Introducing R
Getting R for Microsoft Windows
If you are using a Windows machine, go to the Comprehensive R Archive Network (CRAN) and download the R installer here. After you have installed the program, you can type instructions into the console window and have R give you feedback. There is also a primitive set of tools for writing code, managing R and tweaking the appearance of the console. The important point is that after you have installed the R program, you will have the R “engine” on your machine and other programs can make R friendlier.
After you install R, you may have two icons on your desktop. You will want to use RStudio (which you will download below) instead of either of these versions of R. If you would like, you can try to open either version of R (the x64 version will only work on some version of Windows) but keep in mind that you will use RStudio instead of these versions of R.
Getting R for Mac OS
If you are using a Mac, go to the Comprehensive R Archive Network (CRAN) and download the R installer package here. This will give you the R “Engine” which, when you install the software, will allow you to type instructions and have R give you feedback. The important point is that after you have installed the R program, you will have the R “engine” on your machine and other programs can make R friendlier.
You can open the version of R that you just downloaded but don't bother because you will use RStudio (which you will download below) instead of this version of R.
How to Make R Friendlier
The tools that ship with the R engine are spartan. Many people prefer to download and use RStudio Desktop (rstudio.org/download/desktop) after the R engine is installed. RStudio gives a friendlier look and feel, including things like point and click views of datasets, a color coding editor and the ability to resize graphics on the fly.
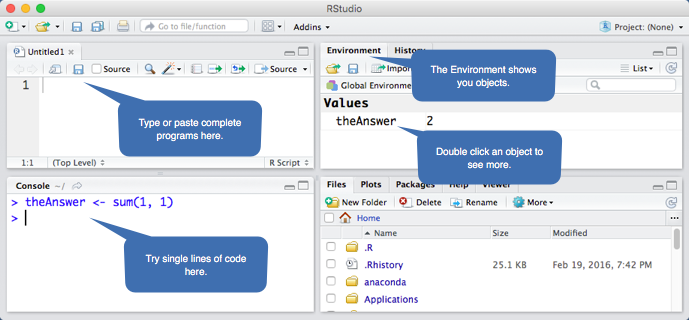
Both the basic R tools and RStudio give you a console window where you can type commands and push Enter/Return to have R display results. With R Studio, you want to be sure to click on the bar labeled source above the console to show the coding window. There you can type complete programs, highlight them and push the run button to have R do complex sets of tasks. Much of RStudio is self-evident but if you would like to learn more, take a look at Getting Started with R Studio by John Verzani.
After you have downloaded both R and R studio start RStudio.
How to Give R More Functionality
R has many add-on packages, written by users all around the world, which add functionality. For example, the package called "foreign" allows you to convert data from other software packages, like SAS or STATA, into R's format and the package "epitools" allows you to do common statistics for epidemiology. The first time you start R, you will want to add in a set of useful packages, including all those used in Presenting Medical Statistics. Copy and paste the following line into the R console and then push Enter:
usefulPackages <- c("car", "foreign", "hexbin", "ggplot2", "Hmisc", "reshape", "Rcmdr", "psych", "epitools")
Pushing Enter after typing an R command is called running the code. Next, tell R to download and install those add-on packages by copying and pasting (or typing) this line:
install.packages(usefulPackages, dependencies = TRUE)
After you push enter you will see a lot of feedback in the console as R downloads and installs the packages.
How R Works
To manipulate and analyze data with R, you will type keywords, that R already knows, into a text editor and then tell R to “run”, that is evaluate/do, the instructions. Those instructions typically appear as a keyword followed by details inside of parentheses. R does some work and saves the results as an object with the name you provide.
For example, this line of code: theAnswer <- sum(1, 1) instructs R to apply the function sum to two things inside the parentheses and assign the result of the function to the object called theAnswer. You can type that line in the Console window (the bottom left windowpane below) or as an R script (in the top left windowpane). If you don't see the script windowpane click the icon in the upper right corner of the Console windowpane. If you type the line in the Console window, push the return/enter key on your keyboard and R will run it. The Console is useful for interactively exploring your data by typing one simple instruction, looking at the results and then trying another. Complex projects require you to write many instructions over several days, while you can type them one at a time into the console window, you will want to be able to save your work so you can reproduce/continue your work tomorrow. The easiest way to do that is to type the instructions into the script window, click and drag to highlight the code, and then push the run button. When the code is working push the save (floppy disk button) in the upper right corner of the script window.

After you have run this line of code, there is an object called theAnswer which is holding the number 2. You can see the answer by typing the name of the object, theAnswer, and pushing the Enter/Return key or by looking in the workspace view of RStudio.
You can use functions to create data frames (what other programs would call analysis datasets) from scratch if your research results are stored on paper, but more likely, you will want to read in data from outside sources like Microsoft Excel or REDCap. REDCap will create a program full of R functions that will load the data when it is run. If you don’t have a tool like REDCap, you will use a function like read.xls() to import data into a data frame for R to analyze. The datasets for this book have already been saved as R data frames. To load them, you only need to use the load function and specify where your data is saved. On a Mac, you will want to type something like: load("~/Documents/Presenting/data/rData/ghana.RData"). This will cause R to load a dataset called ghana into its working memory. Because R began in the UNIX world, the path to where data is stored on Windows is written using double backslashes. For example: load("C:\\Books\\Presenting\\data\\rData\\ghana.RData").
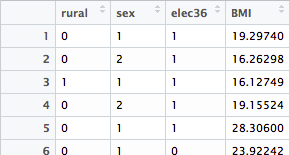
R analysis data frames typically contain one row for each person and a column for each attribute which you are assessing. For example, the ghana dataset is organized like this:

If you want to calculate the average of the BMI column in the ghana dataset, you can type either of these instructions: mean(ghana$BMI) or with(ghana, mean(BMI)). The with() function indicates which data frame is being processed and is somewhat easier to read than the direct reference to the BMI object inside of the ghana object.
If you accidentally type bmi instead of BMI, R will generate an error complaining that the bmi object is not found. R is case sensitive. To get your code to work, you need to use the right words with the correct capitalization. While you will eventually want to memorize R's arcane keywords for doing analyses, you can begin by copying pasting and modifying code. Just be careful of the capitalization.
How can I get a point and click version of R?
One of the packages which you installed above contains the library named Rcmdr, that is, R Commander. R Commander includes a fairly full-featured set of point and click tools for doing basic data manipulation and analyses. To start it, run library(Rcmdr) from the command line in the default R console or the R Studio console. R Commander coexists nicely with R Studio.
Another good tool for people who want to do point and click R analyses and graphics is Deducer: www.deducer.org. It has particularly strong tools for doing graphics. Deducer is easy to set up and run from the default R console (but not the console window in R Studio). Follow the instructions on the website.
Comments about comments on this webstie
By default, R echoes your code into the output when you run it. To help improve the readability of the output, all comments have been removed from the output images. The code below the images includes many comments to help teach R and explain how each step works. Run the code and you will see the output and all the code intermixed.
The first time a function is used in each chapter, there are many comments. Later calls to the same function will typically not have the same amount of documentation. So check the first programs in a chapter for lots of advice.
Color coded R code
When you click on the text labeled "Click here to show the code with comments" you will see pretty colored code. The coloring tool, called Pretty R, was provided at inside-R.org. Microsoft bought the company that developed the site, Revolutions Analytics, in 2015 and sadly the tool went offline in late 2016. Even though the links to Pretty R now redirect to Microsoft's version of R, in the probably vain hope that they will reinstate the Pretty R, I left the links on my pages.