Introducing SAS University Edition
Getting and Installing SAS University Edition
The installation for SAS University Edition (SAS UE) is easy if you read the instructions (or watch the tutorial video). The install is a bit unusual because it requires you to download and install Oracle VirtualBox before you install SAS UE. You can get the software here. If you just push Next Next Next durring the install the software will install but it will not work. Read and follow the instructions.
How SAS University Edition works
SAS University Edition allows you to point and click your way through common data management and analysis tasks. It also allows you to write or modify code to automate tasks. The point and click system, what a programmer would call a Graphical User Interface (GUI, pronounced gooey), lightens the memory load for novices and seeing code grow with every tweak of a checkbox or choice from a dropdown menu makes learning painless.
Happily the SAS UE GUI is easy to use and largely self explanatory. That said, most people eventually get tired of doing the same point and click tasks and they want to save themselves the time by modifying the code that the GUI produces. The goal of this introduction is to help make the transition from pointing and clicking to code as painless as possible.
The SAS portion of this website provides you with the code for many tasks which are available in the GUI as well as tasks that are currently missing from the GUI (such as survival analysis). Here you will find SAS UE specific instructions. Read the How SAS Works web page which can be found here next.
How to Access SAS Datasets in SAS UE
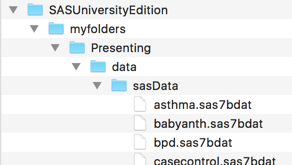
When you installed SAS UE, you created a folder called myfolders inside of another folder called SASUniversityEdition. To access the datasets that are used with this book, create a folder called Presenting (capitalization matters to SAS UE when you are choosing a file path) inside of the myfolders folder. Inside the Presenting folder make a folder called data and inside of that folder make a folder called sasData. Put the SAS datasets for this book inside of that folder. The organization should look like this:

SAS will not realize that the data is in that folder until you tell it to look.
Because SAS has been around since before the creation of Microsoft Windows and Mac OS, it has its own term for a "Folder" on a hard drive. SAS calls a folder full of data a "library". While libraries can be complex things (like databases), as a novice, think of a library as a folder full of data. You can point and click to create a library but most people find it easy to just write a one line program to tell SAS where to find data. (Click here if you truely hate to type.) In this case you can make a library reference with a line of code like this:
libname source "/folders/myfolders/Presenting/data/sasData" access = readonly;
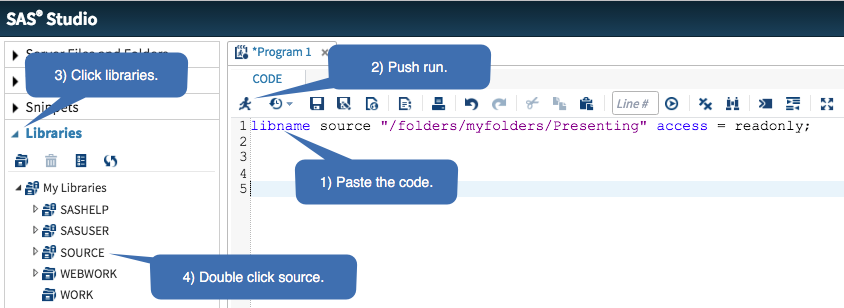
This line makes SAS aware of the folder and it prevents you from accidentally modifying the datasets. Copy and paste this line of code into the program window that is waiting for you when you start SAS UE. (If you are not looking at a blank programming window, hold down the function key (it is labeled fn on a Mac keyboard) and press the f4 key). Next push the running person button. After that, click on the Libraries windowpane on the left side of your browser window and then double click the SOURCE library icon.

That will show you all the datasets. You can click the triangles next to each dataset to see details on the variables (columns) of data or double click the dataset icon to see the dataset itself. You can learn more about interacting with libraries using SAS UE by clicking here.
How to Make Datasets Self Documented
Labels
Research datasets have columns of data (which statisticians and programmers call variables). All programming languages have rules for the names for the columns/variables. SAS expects names to be short (32 or less characters) and they can't contain spaces or begin with numbers. This means that concepts like "when does the patient suffer from allergic rhinitis" end up with variable names like whenrhin. You can tell SAS to apply labels to variables so they will have readable names in reports. Don't worry about the exact syntax because you can download and run a SAS program with all the details here (but do notice that SAS uses ; to end each statement).
data work.rhinitis;
    set source.rhinitis;
    label whenrhin "When does the patient suffer from allergic rhinitis?";
run;
This tells SAS to make a copy of the rhinitis dataset and save it into a temporary library (a folder) called work. After running that program, your SAS output when processing that new rhinitis dataset will show the label rather than the nebulous, short variable name, whenrhin.
Formats
Don't panic if this section seems complicated. The program which you downloaded above will label and format your datasets so they work well in the SAS UE GUI. Learn as much as you can but you can rely on the code if the details are overwhelming. Research datasets typically use code numbers to represent categorical variables. For example, a dataset which has information on allergic rhinitis could have a column which has code numbers that holds information on when the patient is typically sick. SAS uses a "formatting procedure", called proc format, to help decode values. This block of code tells SAS to create a "format" that can be used to decode the values 1, 2 or 3.
proc format library = work;
    value $season
        "1" = "Dry season"
        "2" = "Wet season"
        "3" = "Anytime"
    ;
run;
After that "proc format" block of code has been run, the format can be applied to a dataset like this:
data work.rhinitis;
    set source.rhinitis;
    format whenrhin $season. ;
run;
That code makes a copy of the rhinitis dataset in a temporary library (folder) called work. If you use the SAS UE GUI to analyse the copy of the rhinitis dataset in the work library/folder, the output will show statistics labeled with Dry season, Wet season or Anytime instead of 1, 2, 3.
The proc format code is a bit tricky because SAS keeps track of two different kinds of data, numeric and character. Numeric data can be used for math and character data can not. You can spot character formats because they begin with a $. Data like medical record numbers can be stored as character data to prevent exhausted researchers from accidentally calculating the average medical record number for a data set. The format above is a character format. If that variable was numeric, the format would look like this:
proc format library = work;
    value season
        1 = "Dry season"
        2 = "Wet season"
        3 = "Anytime"
    ;
run;
Do notice the lack of the $ and that the code numbers are not inside quotes.