Introducing SPSS
Working with SPSS
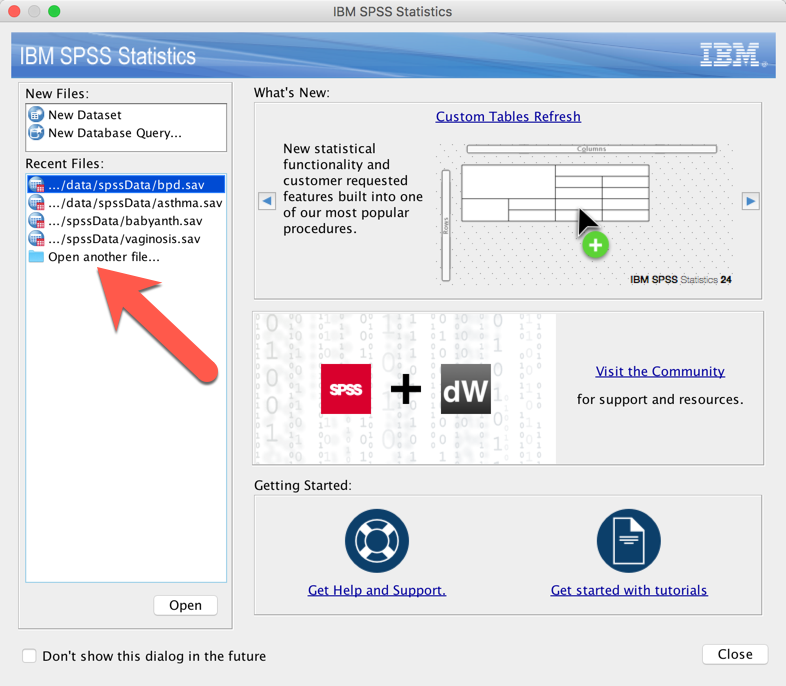
As a beginner, you will want to use SPSS’ point and click system. Loading the datasets for this book is as simple as clicking “Open another file …” in the “Recent Files:” list in the window that shows up when you start SPSS and then finding the folder with datasets that you can download from this website.

After opening the data, SPSS will show you the data in a grid that looks a lot like a spreadsheet. At the bottom of the screen is a button labeled “Variable View.” You can click that to see the details on all the columns of data.
Doing tasks with SPSS is simple because the menus are well labeled. For example, opening another dataset is as simple as choosing “Open > Data ….” from the File menu. Common analyses are of course listed under the Analysis menu.
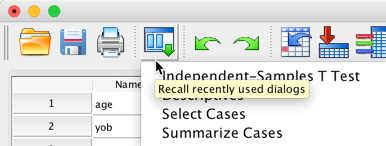
Many statistics instructors have a love/hate relationship with SPSS. Instead of requiring users to memorize an arcane programming language which is unforgiving if you misspell a word or forget a semicolon, SPSS requires only that you recognize a task on a menu and click a couple of times. That is a beautiful thing. SPSS takes the ease of use to the next level by letting you return to an analysis that you have done recently with a click of the “Recall recently used dialogs” button.

However, that design also makes it particularly easy for you to do the wrong analysis. While we provide you lots of examples, when in doubt, ask an expert for advice on what menu option to click. Another design feature that is both a blessing and a curse for SPSS users is the lack of automatic diagnostic graphics. By default, other languages, like SAS, produce many graphics when you do an analysis. These are wonderful for experts but bewildering for novices. Because these plots are not done by default in SPSS, it is critical that you follow our instructions from Chapter 5 and look at your data before you do an analysis. Make sure that the data has the right distribution instead of blindly using the p-values that a t-test produces. (Don’t worry, that will make sense as you read the book.)
Explore SPSS and Study the Code
As you point and click, you will see code is being added to the Statistics Viewer window. If you are brave and study the code a bit, you can learn the SPSS syntax. Eventually you will be tired of pointing and clicking and you can write your own code based on what you see written by SPSS as you point and click.
What if a statistic is not in the menus?
SPSS can do a lot but a frequently heard complaint is that the menus/options are limited. That is true but SPSS is taking great steps by allowing you to do basically any statistic by using extensions and custom dialogs. These tasks are advanced but if you love SPSS, you can use SPSS’ integration Plugin for R to hide extremely complex tasks behind SPSS’s friendly appearance. Take a look at the R section of this website to get some ideas about how R works and if you want to invest the time, dig into the Working with R section of the SPSS documentation.