Chapter 10: Multifactorial analyses using SPSS
Figure 10.1 Output for one-way analysis of variance
Box 10.3 Presenting the results for one-way analysis of variance
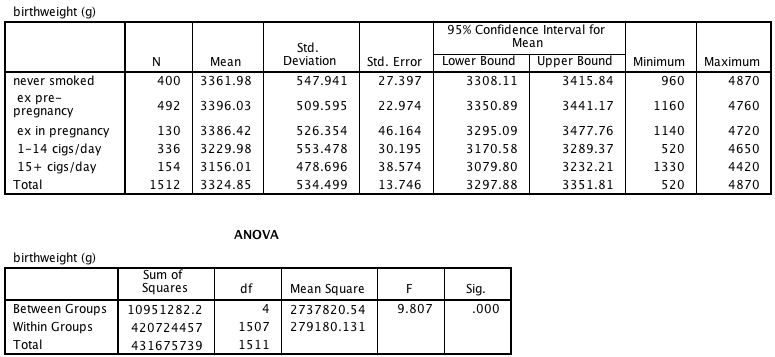
Figure 10.1 and Box 10.3 Instruction
Click here to show the instructions as text.
- Open the file.
- From the File menu choose Open > Data....
- Find the file smokingbwt.sav and open it.
- Tell SPSS to do an ANOVA.
- From the Analyze menu choose Compare Means > One-Way ANOVA....
- Drag birthwt to the Dependent List: box.
- Drag smokegroup to the Factor: box.
- Click Options....
- In the Statistics seciton check on the Descriptive checkbox.
- Click Continue.
- Click OK.
Figure 10.2 Output for multiple regression
Box 10.5 Presenting the results of multiple regression
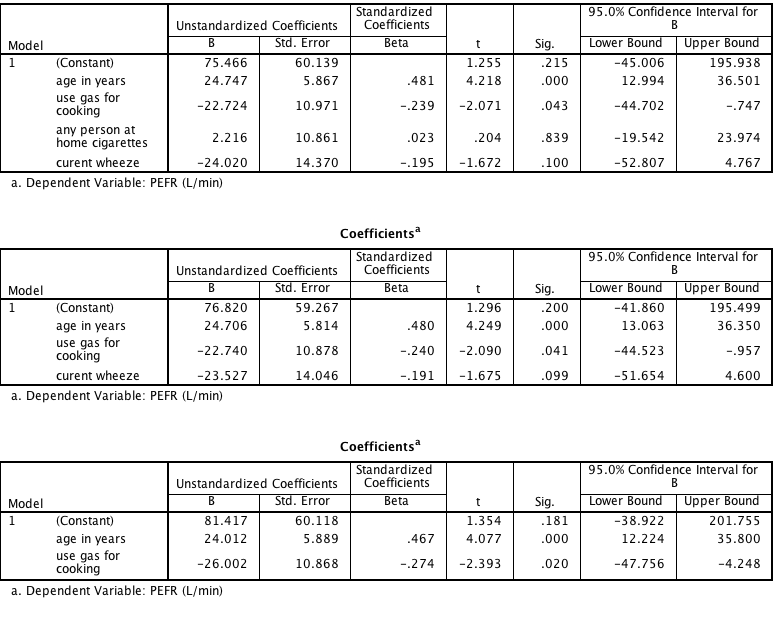
Figure 10.2 and Box 10.5 Instruction
Click here to show the instructions as text.
- Open the file.
- From the File menu choose Open > Data....
- Find the file perf.sav and open it.
- Tell SPSS to do a multiple regression.
- From the Analyze menu choose Regression > Linear....
- If a window appears asking you to set measurement level, click OK.
- Drag perf to the Dependent: box.
- Drag age, gas, smokers, wheeze to the Independent(s): box.
- Click Statistics....
- In the Regression Coefficients section check the Confidence intervals checkbox.
- Uncheck the Model fit checkbox.
- Click Continue.
- Click OK.
- Tell SPSS to do a multiple regression with smokers dropped.
- From the Analyze menu choose Regression > Linear....
- If a window appears asking you to set measurement level, click OK.
- Drag perf to the Dependent: box.
- Drag age, gas and wheeze to the Independent(s): box.
- Click Statistics....
- In the Regression Coefficients section check the Confidence intervals checkbox.
- Uncheck the Model fit checkbox.
- Click Continue.
- Click OK.
- Tell SPSS to do a multiple regression with smokers and wheeze dropped.
- From the Analyze menu choose Regression > Linear....
- If a window appears asking you to set measurement level, click OK.
- Drag perf to the Dependent: box.
- Drag age and gas to the Independent(s): box.
- Click Statistics....
- In the Regression Coefficients section check the Confidence intervals checkbox.
- Uncheck the Model fit checkbox.
- Click Continue.
- Click OK.
Figure 10.3 Output from multiple regression with categorical predictor variables
Box 10.8 Presentation of multiple regression with categorical predictor variable
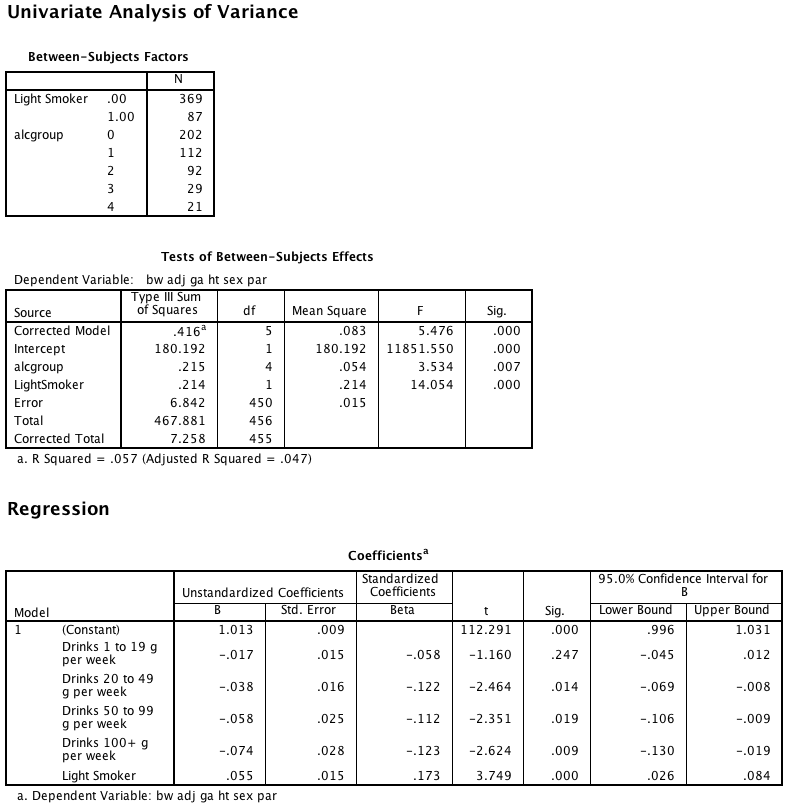
Figure 10.3 and Box 10.8 Instruction
Click here to show the instructions as text.SPSS does not automatically code categorical predictors into a set of (dummy) predictor variables when it does regression. The instructions below explain how to make them.
- Open the file.
- From the File menu choose Open > Data....
- Find the file smokingbwt.sav and open it.
- First check to see if there is missing predictor data.
- From the Analyze menu choose Descritpive Statistics > Frequencies....
- Drag smokegroup and alcgroup to the Variable(s) box.
- Click OK.
- Exclude records that have missing values..
- From the Data menu choose Select cases....
- In the Select section, choose the If condition is satisfied radio button.
- Click If....
- In the box at the top of the Select cases: If type not (sysmis(cigsgp) | sysmis(alcgroup)). That is, select the records where the data is not missing alcohol or smoking group data.
- Click OK.
- Make a 0 or 1 coded dummy variable indicating who is a heavy smoker. Note that you don't need to make a dummy variable indicator of who is not a heavy smoker because you know it using this one variable.
- From the Transform menu choose Recode into different variables....
- Drag alcgroup to the String Variable -> Output Varible: box.
- Click Old and New Values....
- Type 2 in the Old Value Value: box.
- Type 0 in the New Value Value: box.
- Click Add.
- Type 1 in the Old Value Value: box.
- Type 1 in the New Value Value: box.
- Click Add.
- Click Continue.
- Type LightSmoker in the Output Variable Name: box.
- Type A light smoker in the Output Label Name: box.
- Click Change.
- Click OK.
- Predict adjusted baby weight with smoking group and alcohol (using a linear model / ANOVA).
- From the Analyze menu choose General Linear Model > Univariate....
- Drag adjbw to the Dependent Variable: box.
- Drag lightSmoker and alcgroup to the Fixed Factor(s): box.
- Click OK.
- Make a set of 0 or 1 coded dummy variables indicating the amount of alcohol consumed by drinks. Note that you don't need to make a dummy variable indicator of who does not drink any alcohol because that person would be coded with zeros on all the drinking (amount) variables.
- From the Transform menu choose Recode into different variables....
- Drag alcgroup to the String Variable -> Output Varible: box.
- Click Old and New Values....
- Type 1 in the Old Value Value: box.
- Type 1 in the New Value Value: box.
- Click Add.
- Click the All other values radio button.
- Type 0 in the New Value Value: box.
- Click Add.
- Click Continue.
- Type drink1_19 in the Output Variable Name: box.
- Type Drinks 1 to 19 g per week in the Output Label Name: box.
- Click Change.
- Click OK.
- From the Transform menu choose Recode into different variables....
- Drag alcgroup to the String Variable -> Output Varible: box.
- Click Old and New Values....
- Type 2 in the Old Value Value: box.
- Type 1 in the New Value Value: box.
- Click Add.
- Click the All other values radio button.
- Type 0 in the New Value Value: box.
- Click Add.
- Click Continue.
- Type drink20_49 in the Output Variable Name: box.
- Type Drinks 20 to 49 g per week in the Output Label Name: box.
- Click Change.
- Click OK.
- From the Transform menu choose Recode into different variables....
- Drag alcgroup to the String Variable -> Output Varible: box.
- Click Old and New Values....
- Type 3 in the Old Value Value: box.
- Type 1 in the New Value Value: box.
- Click Add.
- Click the All other values radio button.
- Type 0 in the New Value Value: box.
- Click Add.
- Click Continue.
- Type alcgroup in the Output Variable Name: box.
- Type Drinks 50 to 99 g per week in the Output Label Name: box.
- Click Change.
- Click OK.
- From the Transform menu choose Recode into different variables....
- Drag alcgroup to the String Variable -> Output Varible: box.
- Click Old and New Values....
- Type 4 in the Old Value Value: box.
- Type 1 in the New Value Value: box.
- Click Add.
- Click the All other values radio button.
- Type 0 in the New Value Value: box.
- Click Add.
- Click Continue.
- Type drink100 in the Output Variable Name: box.
- Type Drinks 100+ g per week in the Output Label Name: box.
- Click Change.
- Click OK.
- Tell SPSS to do a multiple regression with the dummy coded categorical variables.
- From the Analyze menu choose Regression > Linear....
- If a window appears asking you to set measurement level, click OK.
- Drag adjbw to the Dependent: box.
- Drag HeavySmoker, drink1_19, drink20_49, drink50_99, and drink100 to the Independent(s): box.
- Click Statistics....
- In the Regression Coefficients section check the Confidence intervals checkbox.
- Uncheck the Model fit checkbox.
- Click Continue.
- Click OK.
Figure 10.5 Output for logistic regression
Box 10.12 Presenting the results for logistic regression
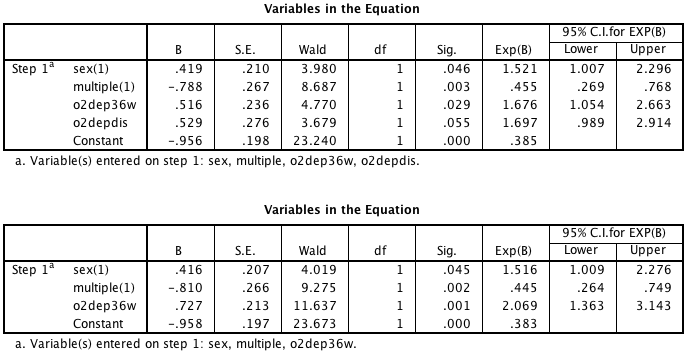
Figure 10.5 and Box 10.2 Instruction
Click here to show the instructions as text.
- Open the file.
- From the File menu choose Open > Data....
- Find the file bpd.sav and open it.
- Tell SPSS to do logistic regression to predict use of drugs with 4 variables.
- From the Analyze menu choose Regression > Binary Logistic....
- Drag chest to the Dependent: box.
- Drag sex, multiple, o2dep36w, o2depdis to the Dependent: box.
- Click Categorical....
- Drag sex and multiple to the Categorical Covariates: box.
- Set Contrast to be Simple
- Push the First radio button.
- Click Change and make sure both variables should be listed with (indicator(first)). Repeat the steps above on each variable if needed.
- Click Continue.
- Click Options....
- In the Statistics and Plots section check the CI for exp(B) checkbox.
- Click Continue.
- Click OK.
- Tell SPSS to do logistic regression to predict use of drugs with 3 variables.
- From the Analyze menu choose Regression > Binary Logistic....
- Drag chest to the Dependent: box.
- Drag sex, multiple and o2dep36w to the Dependent: box.
- Click Categorical....
- Drag sex and multiple to the Categorical Covariates: box.
- Set Contrast to be Simple.
- Push the First radio button.
- Click Change and make sure both variables should be listed with (indicator(first)). Repeat the steps above on each variable if needed.
- Click Continue.
- Click Options....
- In the Statistics and Plots section check on the CI for exp(B) checkbox.
- Click Continue.
- Click OK.
Figure 10.6 Output for logistic regression with categorical predictor variables
Box 10.14 Presenting logistic regression with categorical predictor variables
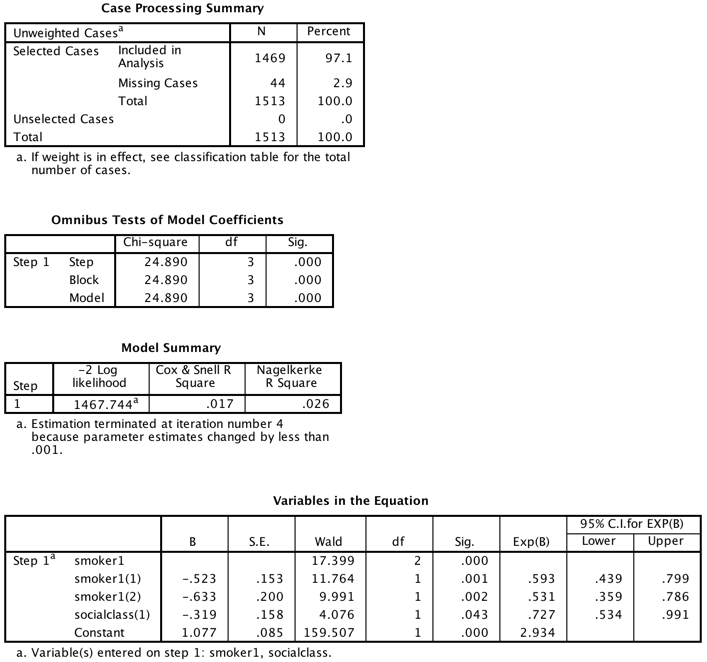
Figure 10.6 Instruction
Click here to show the instructions as text.
- Open the file.
- From the File menu choose Open > Data....
- Find the file smokingbwt.sav and open it.
- Tell SPSS to do logistic regression to predict use of drugs with 2 categorical variables.
- From the Analyze menu choose Regression > Binary Logistic....
- Drag nausea to the Dependent: box.
- Drag smoker1 and socialclass to the Covariates: box.
- Click Categorical....
- Drag smoker1 and socialclass to the Categorical Covariates: box.
- Set Contrast to be Simple
- Push the First radio button.
- Click Change and make sure both variables should be listed with (indicator(first)). Repeat the steps above on each variable if needed.
- Click Continue.
- Click Options....
- In the Statistics and Plots section check on the CI for exp(B) checkbox.
- Click Continue.
- Click OK.
Box 10.15 Presenting unadjusted and adjusted logistic regression

Box 10.15 Instruction
SPSS can not easily make this output.