Chapter 11: Survival analysis using SPSS
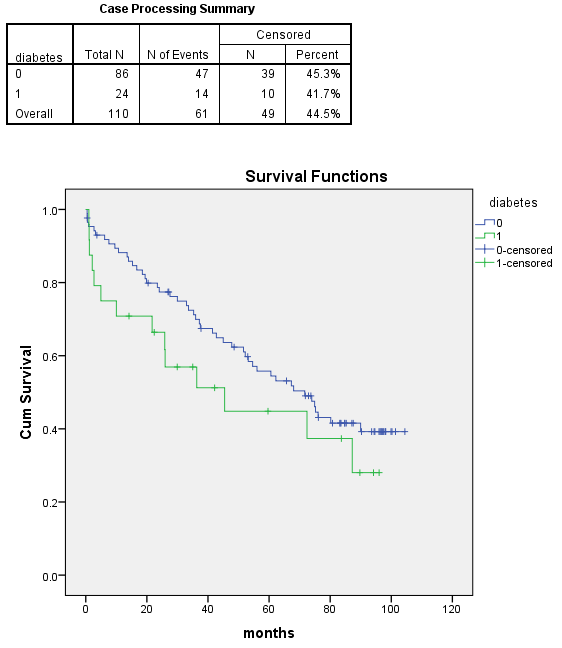
Figure 11.1 Kaplan–Meier curve

Figure 11.1 Instruction
Click here to show the instructions as text.Figure 11.2 Kaplan–Meier curve with logrank test

Figure 11.2 Instruction
SPSS can not automatically add the number at risk to a survival plot. You can add text boxes to the above graphic (by double clicking the graphic and from the Options menu choosing Text Box) and inset the p-value and attempt to align the numbers above the axis. Consider using other software if you need this plot.
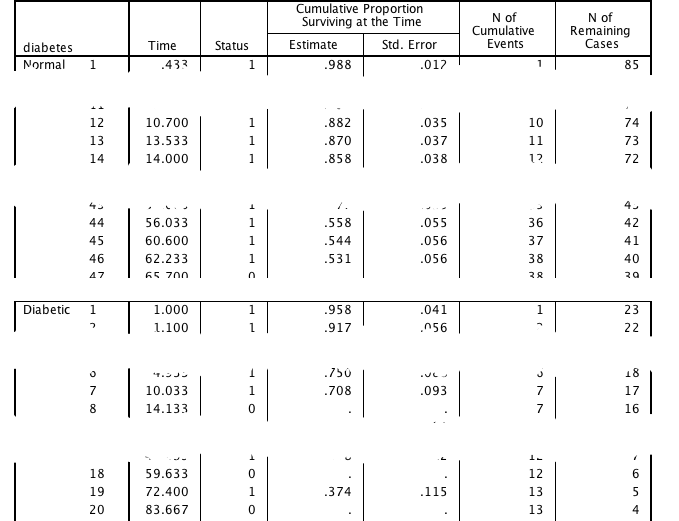
Figure 11.4 Output for Kaplan–Meier estimates of survival and logrank test

Figure 11.4 Instruction
Click here to show the instructions as text.Figure 11.5 Output for Cox regression with one predictor available

Figure 11.5 Instruction
Click here to show the instructions as text.Figure 11.6 Output for Cox regression with more than one predictor variable
Box 11.8 Presenting Cox regression analysis
