Home > Output
Chapter 11: Survival analysis using STATA
Figure 11.1 Kaplan–Meier curve
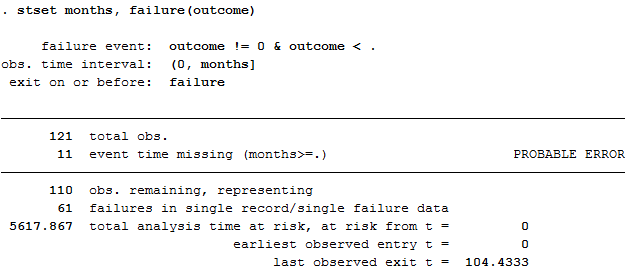
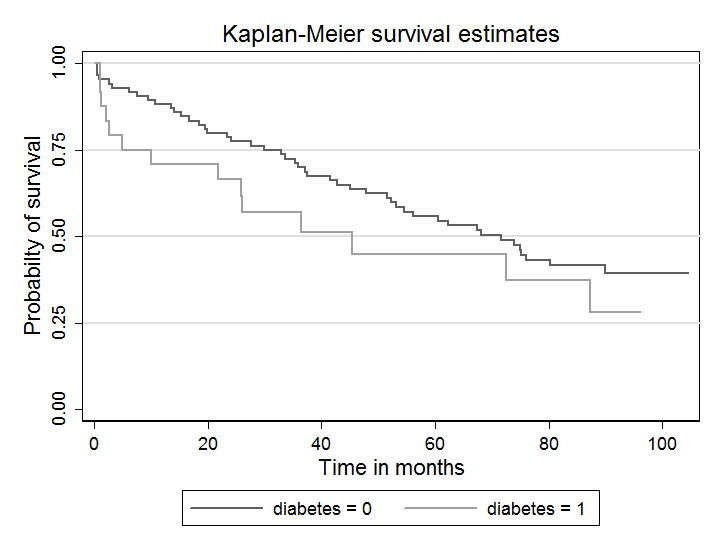
Figure 11.1 Code

Click here to show code as text
set scheme s1manual   // Plain look in graphics

use "C:\Projects\Books\Presenting\data\stataData\pvd.dta", clear
stset months, failure(outcome)
sts graph, by(diabetes) ytitle(Probabilty of survival) xtitle(Time in months)
Figure 11.2 Kaplan–Meier curve with logrank test
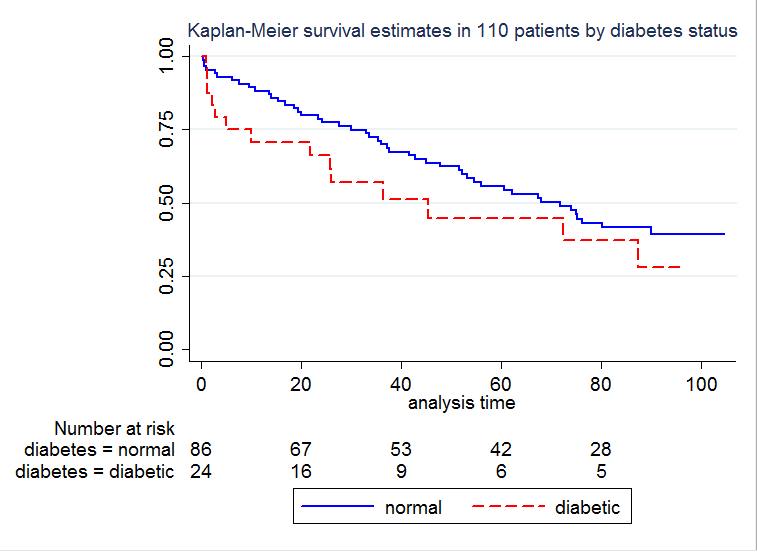
Figure 11.2 Code
Click here to show code as text
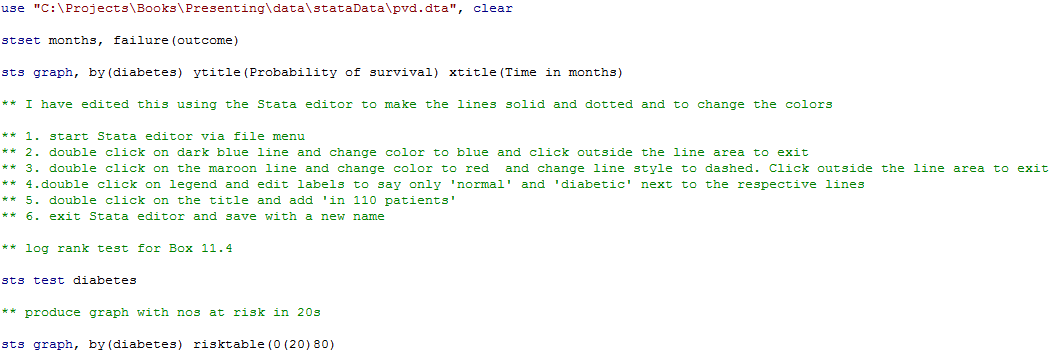
use "C:\Projects\Books\Presenting\data\stataData\pvd.dta", clear

stset months, failure(outcome)

sts graph, by(diabetes) ytitle(Probability of survival) xtitle(Time in months)

** I have edited this using the Stata editor to make the lines solid and dotted and to change the colors

** 1. start Stata editor via file menu
** 2. double click on dark blue line and change color to blue and click outside the line area to exit
** 3. double click on the maroon line and change color to red  and change line style to dashed. Click outside the line area to exit
** 4.double click on legend and edit labels to say only 'normal' and 'diabetic' next to the respective lines
** 5. double click on the title and add 'in 110 patients'
** 6. exit Stata editor and save with a new name

** log rank test for Box 11.4

sts test diabetes

** produce graph with nos at risk in 20s

sts graph, by(diabetes) risktable(0(20)80)
Figure 11.3
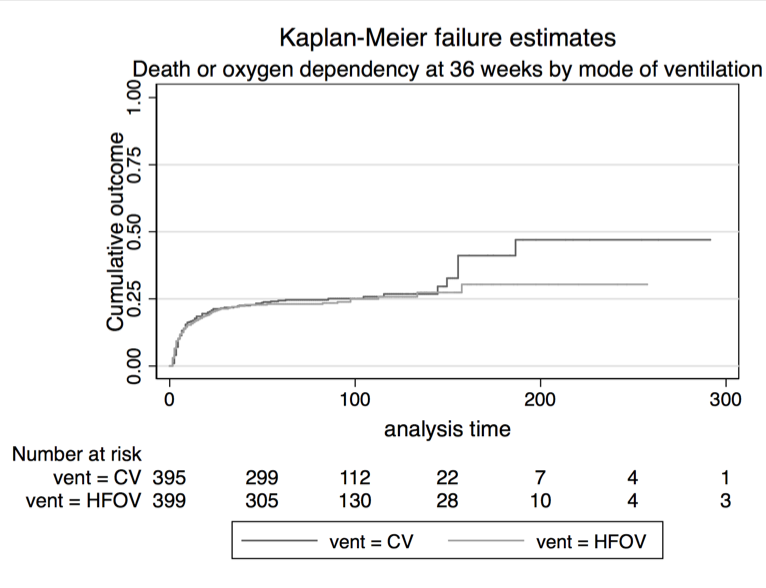
Figure 11.3 Code

Click here to show code as text
label define vent 0 "CV" 1 "HFOV"
label values vent vent

replace days=days+0.5
stset days, failure(died)

sts graph, fail by(vent) tmax(300) risktable(0 50 100 150 200 250 300) ///
  t1("Death or oxygen dependency at 36 weeks by mode of ventilation")  ///
  ytitle("Cumulative outcome")


sts test vent, cox
Figure 11.4 Output for Kaplan–Meier estimates of survival and logrank test
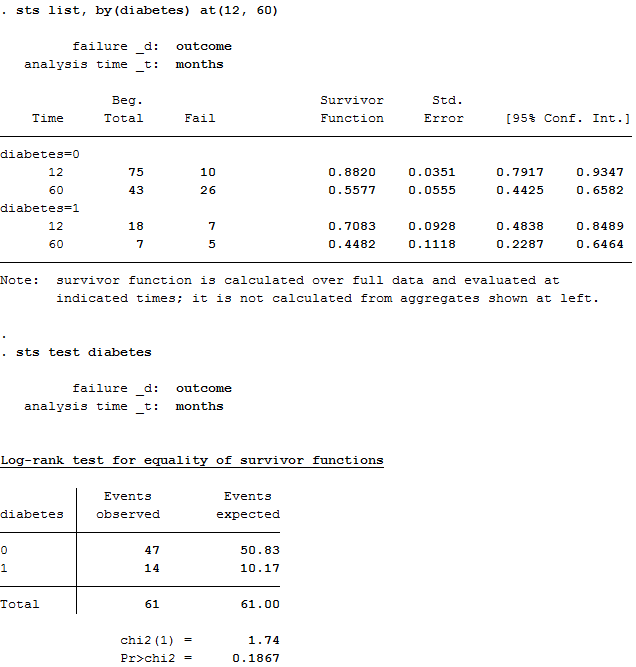
Figure 11.4 Code

Click here to show code as text
use "C:\Projects\Books\Presenting\data\stataData\pvd.dta", clear
stset months, failure(outcome)
sts list, by(diabetes) at(12, 60)
sts test diabetes
Figure 11.5 Output for Cox regression with one predictor available
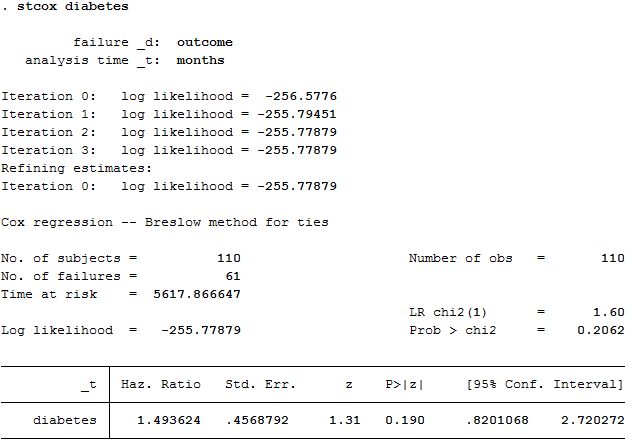
Figure 11.5 Code

Click here to show code as text
use "C:\Projects\Books\Presenting\data\stataData\pvd.dta", clear
stset months, failure(outcome)
stcox diabetes
Figure 11.6 Output for Cox regression with more than one predictor variable
Box 11.8 Presenting Cox regression analysis
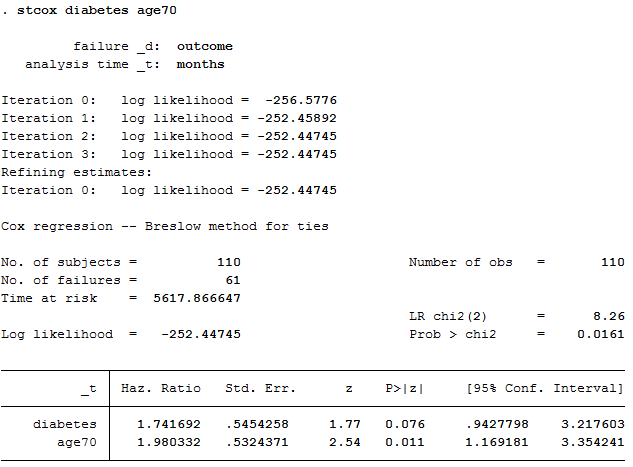
Figure 11.6 and Box 11.8 Code

Click here to show code as text
use "C:\Projects\Books\Presenting\data\stataData\pvd.dta", clear
stset months, failure(outcome)
stcox diabetes age70


