Home > Output
Chapter 13: Presenting a meta-analysis using STATA
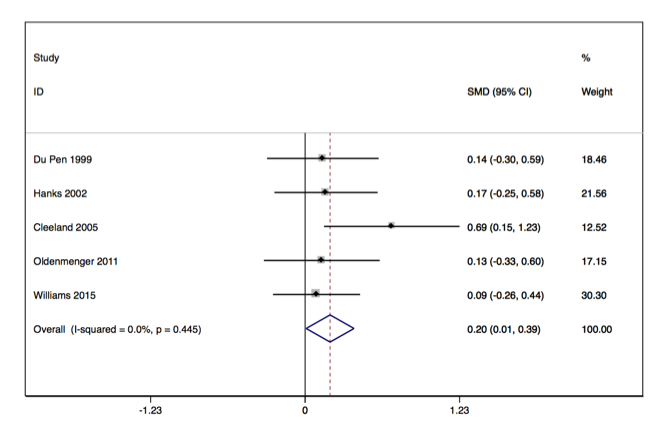
Figure 13.4 Forest plot displaying the results of a meta- analysis of studies with a continuous
outcome

Figure 13.4 Code

Click here to show code as text
set scheme s1manual   // Plain look in graphics

** if not installed, download Stata suite of commands for meta analysis
** see http://www.stata.com/support/faqs/statistics/meta-analysis/

*** run this command once to add the meta analysis command:
*** ssc install metan


use "C:\Projects\Books\Presenting\data\stataData\meta.dta", clear
metan   n01 m01 sd01 n11 m11 sd11 if outcome==1, label(namevar = id) texts(150)
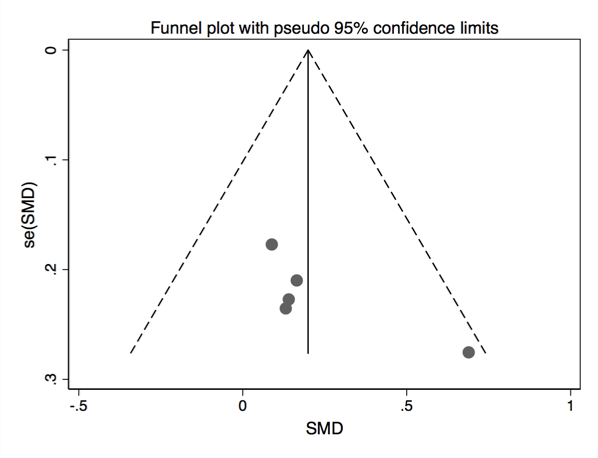
Figure 13.5 Funnel plot to explore publication bias

Figure 13.5 Code

Click here to show code as text
set scheme s1manual   // Plain look in graphics

** if not installed, download Stata suite of commands for meta analysis
** see http://www.stata.com/support/faqs/statistics/meta-analysis/

*** run this command once to add the meta analysis command:
*** ssc install metan


use "C:\Projects\Books\Presenting\data\stataData\meta.dta", clear
metan   n01 m01 sd01 n11 m11 sd11 if outcome==1, label(namevar = id) texts(150)


