Chapter 2: Introducton to the research process using SAS
Figure 2.1 Portion of a dataset showing data collected for participants in a screening survey (example)
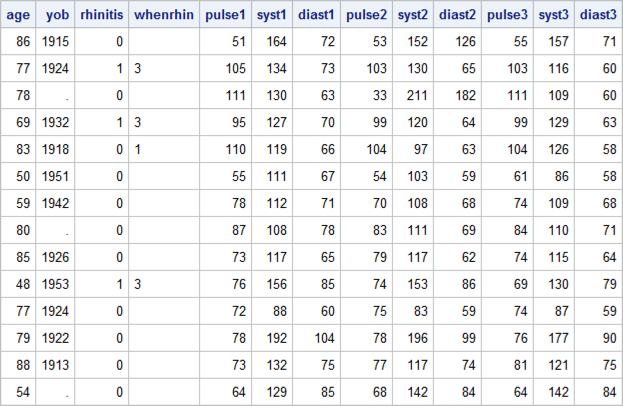
Figure 2.1 Code
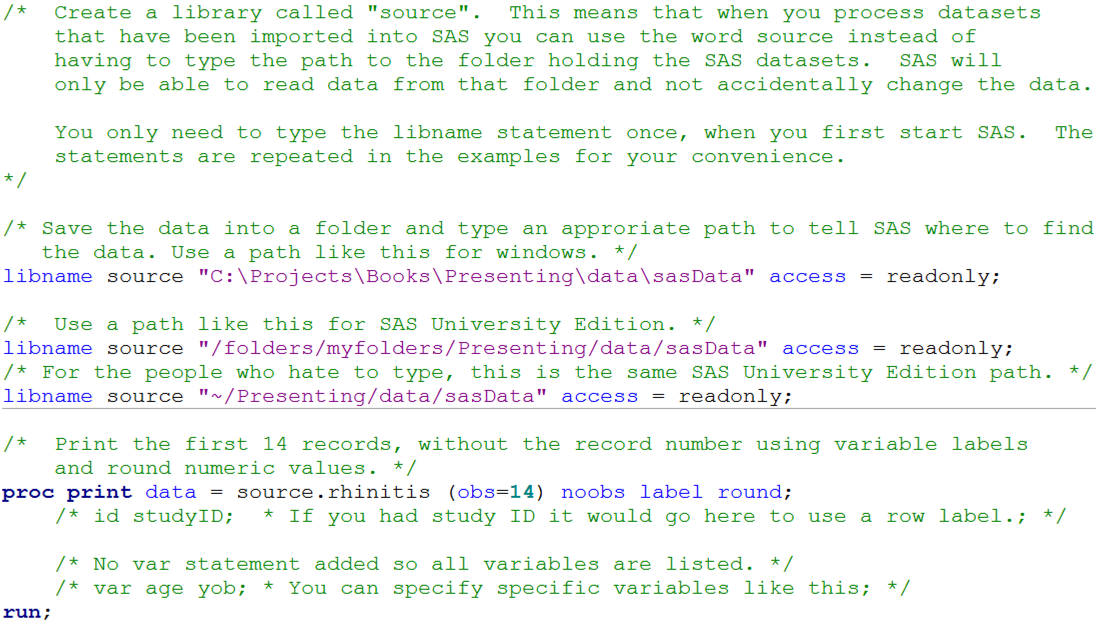
Click here to show code as text
/*  Create a library called "source".  This means that when you process datasets
    that have been imported into SAS you can use the word source instead of
    having to type the path to the folder holding the SAS datasets.  SAS will
    only be able to read data from that folder and not accidentally change the data.

    You only need to type the libname statement once, when you first start SAS.  The
    statements are repeated in the examples for your convenience.
*/

/* Save the data into a folder and type an approriate path to tell SAS where to find
   the data. Use a path like this for windows. */
libname source "C:\Projects\Books\Presenting\data\sasData" access = readonly;

/*  Use a path like this for SAS University Edition. */
libname source "/folders/myfolders/Presenting/data/sasData" access = readonly;
/* For the people who hate to type, this is the same SAS University Edition path. */
libname source "~/Presenting/data/sasData" access = readonly;

/*  Print the first 14 records, without the record number using variable labels
    and round numeric values. */
proc print data = source.rhinitis (obs=14) noobs label round;
    /* id studyID;  * If you had study ID it would go here to use a row label.; */

    /* No var statement added so all variables are listed. */
    /* var age yob; * You can specify specific variables like this; */
run;
Figure 2.3 Checking for errors in the data (example)
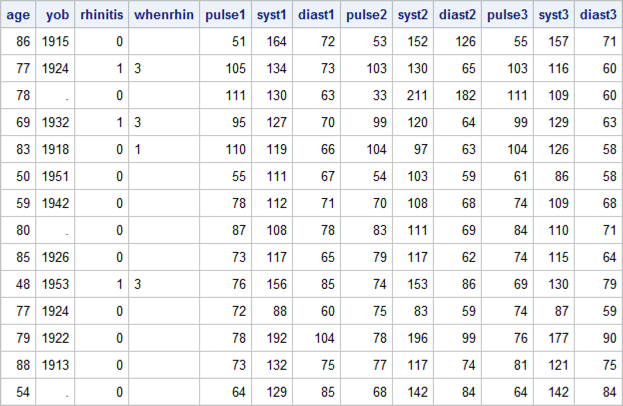
Figure 2.3 Code

Click here to show code as text
/*  Create a library called "source".  This means that when you process datasets
    that have been imported into SAS you can use the word source instead of
    having to type the path to the folder holding the SAS datasets.  SAS will
    only be able to read data from that folder and not accidentally change the data.

    You only need to type the libname statement once, when you first start SAS.  The
    statements are repeated in the examples for your convenience.
*/

/* Save the data into a folder and type an approriate path to tell SAS where to find
   the data. Use a path like this for windows. */
libname source "C:\Projects\Books\Presenting\data\sasData" access = readonly;

/*  Use a path like this for SAS University Edition. */
libname source "/folders/myfolders/Presenting/data/sasData" access = readonly;
/* For the people who hate to type, this is the same SAS University Edition path. */
libname source "~/Presenting/data/sasData" access = readonly;

/*  Print the first 14 records, without the record number using variable labels
    and round numeric values. */
proc print data = source.rhinitis (obs=14) noobs label round;
    /* id studyID;  * If you had study ID it would go here to use a row label.; */

    /* No var statement added so all variables are listed. */
    /* var age yob; * You can specify specific variables like this; */
run;
Figure 2.4 SAS output to check data
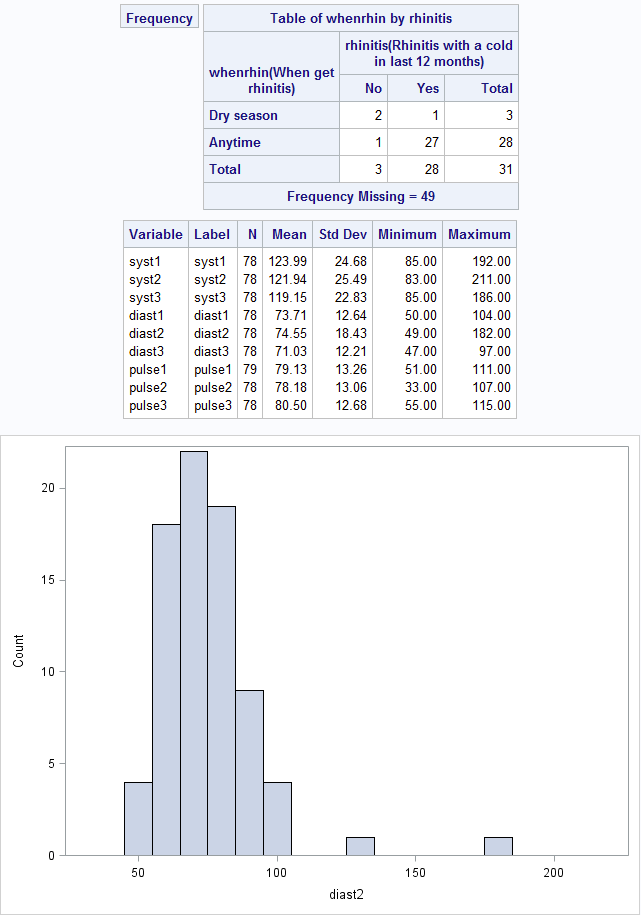
Figure 2.4 Code
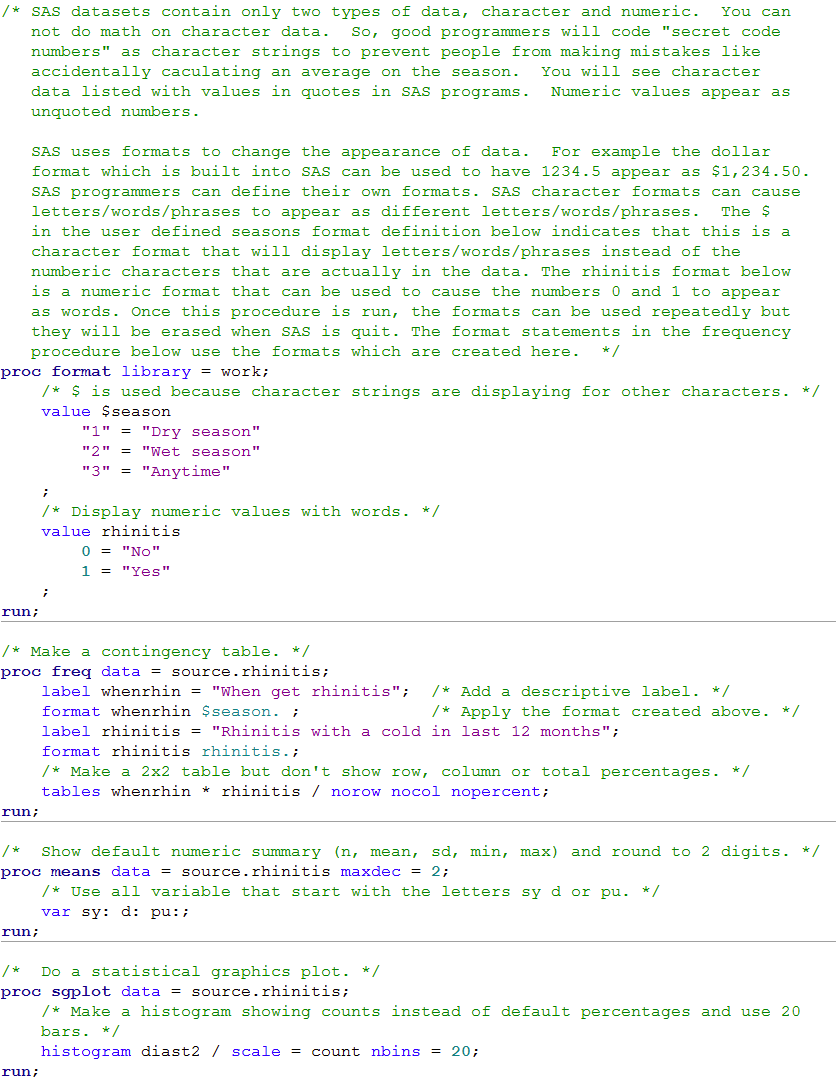
Click here to show code as text
libname source "C:\Projects\Books\Presenting\data\SASData" access = readonly;

/* SAS datasets contain only two types of data, character and numeric.  You can
   not do math on character data.  So, good programmers will code "secret code
   numbers" as character strings to prevent people from making mistakes like
   accidentally caculating an average on the season.  You will see character
   data listed with values in quotes in SAS programs.  Numeric values appear as
   unquoted numbers.

   SAS uses formats to change the appearance of data.  For example the dollar
   format which is built into SAS can be used to have 1234.5 appear as $1,234.50.
   SAS programmers can define their own formats. SAS character formats can cause
   letters/words/phrases to appear as different letters/words/phrases.  The $
   in the user defined seasons format definition below indicates that this is a
   character format that will display letters/words/phrases instead of the
   numberic characters that are actually in the data. The rhinitis format below
   is a numeric format that can be used to cause the numbers 0 and 1 to appear
   as words. Once this procedure is run, the formats can be used repeatedly but
   they will be erased when SAS is quit. The format statements in the frequency
   procedure below use the formats which are created here.  */
proc format library = work;
    /* $ is used because character strings are displaying for other characters. */
    value $season
        "1" = "Dry season"
        "2" = "Wet season"
        "3" = "Anytime"
    ;
    /* Display numeric values with words. */
    value rhinitis
        0 = "No"
        1 = "Yes"
    ;
run;

/* Make a contingency table. */
proc freq data = source.rhinitis;
    label whenrhin = "When get rhinitis";  /* Add a descriptive label. */
    format whenrhin $season. ;             /* Apply the format created above. */
    label rhinitis = "Rhinitis with a cold in last 12 months";
    format rhinitis rhinitis.;
    /* Make a 2x2 table but don't show row, column or total percentages. */
    tables whenrhin * rhinitis / norow nocol nopercent;
run;

/*  Show default numeric summary (n, mean, sd, min, max) and round to 2 digits. */
proc means data = source.rhinitis maxdec = 2;
    /* Use all variable that start with the letters sy d or pu. */
    var sy: d: pu:;
run;

/*  Do a statistical graphics plot. */
proc sgplot data = source.rhinitis;
    /* Make a histogram showing counts instead of default percentages and use 20
    bars. */
    histogram diast2 / scale = count nbins = 20;
run;