Chapter 5: Introduction to presenting statistical analyses using SPSS
Box 5.3 Assessing non-response bias

Box 5.3 Instruction
The Quick and Dirty Way
Click here to show the instructions as text.The first three steps give you the counts you want in seconds. Getting the table to look exactly correct is a nuisance.
- Open the file.
- From the File menu choose Open> Data ....
- Find the file nonResponse.sav and open it.
- Tell SPSS to do a cross tabulation.
- From the Analyze menu, choose Descriptive Statistics > Crosstabs....
- Drag race to the Row(s) box.
- Drag sex to the Column(s) box.
- Click OK.
- Fix the rows and columns.
- Double click the output crosstab table.
- If the Pivoting Trays window appears, close it.
- Click and drag over the Male column (with its heading) to select it. Drag it to the left of Female (or move the female column).
- Click and drag over a race row (with its heading) to select one. Drag each row up or down to get the data in the right order.
- Click and drag over the total column to select it. Right click and delete it.
- Click and drag over the total row to select it. Right click and delete it.
- Click the sex column heading to select it. Right click it and choose Ungroup.
You will manually be tweaking the appearance of the output. You may need to double click the crosstab output repeatedly to select the sections you are adjusting.
The Professional Way
Click here to show the instructions as text.Rather than manually adjusting the columns you can create numeric codes for the races so that they appear in the correct order.
- Open the file.
- From the File menu choose Open> Data ....
- Find the file nonResponse.sav and open it.
- Specify that you want to convert the race variable to be numeric.
- From the Transform menu choose Recode into different variables....
- Drag race to the String Variable -> Output Varible: box.
- Click Old and New Values....
- Type White in the Old Value Value: box.
- Type 1 in the New Value Value: box.
- Click Add.
- Type African origin in the Old Value Value: box.
- Type 2 in the New Value Value: box.
- Click Add.
- Type Asian in the Old Value Value: box.
- Type 3 in the New Value Value: box.
- Click Add.
- Click Continue.
- Type raceN in the Output Variable Name: box.
- Type Race Numeric in the Output Label Name: box. .
- Click Change.
- Click Continue.
- Tell SPSS to display words instead of secret code numbers.
- Select the window showing the nonResponse dataset.
- Click on Variable View (at the bottom of the window).
- Click the Values box/cell for the raceN variable.
- Click on the ....
- Type 1 in the Values: box.
- Type White in the Label: box.
- Click Add.
- Type 2 in the Values: box.
- Type African origin in the Label: box.
- Click Add.
- Type 3 in the Values: box.
- Type Asian in the Label: box.
- Click Add.
- Click OK.
- Tell SPSS to build the table.
- From the Analyze menu choose Custom Tables > Custom Tables....
- Click OK if the Custom Tables window appears.
- Drag raceN to the Rows place holder in the graphic preview (the right windowpane).
- Right click raceN in the graphic preview and uncheck Show Variable Name and Label.
- Drag sex to the Rows place holder in the graphic preview .
- Right click sex in the graphic preview and select Categories and Totals....
- In the Sort Categories section set Order to be Descending.
- Right click sex in the graphic preview and uncheck Show Variable Name and Label.
- Check the Hide checkbox in the Summary Statistics section.
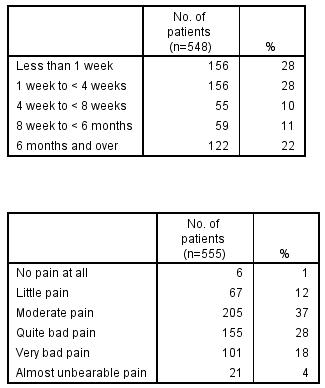
Box 5.4 Population profile from a report

Box 5.4 Instruction
Click here to show the instructions as text.The first three steps give you the counts you want in seconds. Getting the table to look exactly correct is a nuisance.
- Open the file.
- From the File menu choose Open> Data....
- Find the file lbp.sav and open it.
- Tell SPSS to display words instead of secret code numbers.
- Select the window showing the lbp dataset.
- Click on Variable View (at the bottom of the window).
- Click the Values box/cell for the time variable.
- Click on the ....
- Type 1 in the Values: box.
- Type Less than 1 week in the Label: box.
- Click Add.
- Type 2 in the Values: box.
- Type 1 week to < 4 weeks in the Label: box.
- Click Add.
- Type 3 in the Values: box.
- Type 4 week to < 8 week in the Label: box.
- Click Add.
- Click OK.
- Type 4 in the Values: box.
- Type 8 week to < 6 months in the Label: box.
- Click Add.
- Click OK.
- Type 5 in the Values: box.
- Type 6 months and over in the Label: box.
- Click Add.
- Click OK.
- Specify that you want to do a custom frequency table.
- From the Analyze menu choose Custom Tables > Custom Tables....
- Drag time to the Rows place holder in the graphic preview (the right windowpane).
- Right click on time in the graphic preview and uncheck Show Variable Label.
- In the define box (lower left) click Summary Statistics....
- In the Display: box change the label to say No. of patients (N=548).
- From the Selected Variable: Statistics: box drag Column N % into the Display: box to the right.
- Change its label to be %, decimals to be 0, and its format to nnnn .
- Click Apply to Selection. Click OK.
- Double click the custom frequency table.
- Drag the column borders until the table looks good.
- Repeat the previous two steps with the time variable.
Repeat the steps above to recode the pain variable with these codes:
1 = "No pain at all"
2 = "Little pain"
3 = "Moderate pain"
4 = "Quite bad pain"
5 = "Very bad pain"
6 = "Almost unbarable pain"
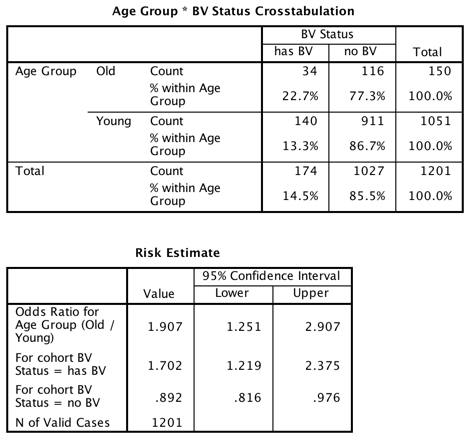
Table 5.1 Single Concise table from a paper with adjusted and unadjusted estimates
Table 5.2 Table suitable for an oral presentation

Table 5.1 and Table 5.2 and Table 5.2 Instruction
Click here to show the instructions as text.- Open the file.
- From the File menu choose Open> Data ....
- Find the file vaginosis.sav and open it.
- Specify that you want to convert the outcome variable so the presence of the predictor is first in alphabetic order. Here has BV comes before no BV..
- From the Transform menu choose Recode into different variables ... .
- Drag bvYes to the String Variable -> Output Varible: box.
- Click Old and New Values... .
- Type 0 in the Old Value Value: box.
- Check on the Output variables are string checkbox.
- Type no BV in the New Value Value: box.
- Click Add.
- Type 1 in the Old Value Value: box.
- Type has BV in the New Value Value: box.
- Click Add.
- Click Continue.
- Type BV in the Output Variable Name: box.
- Type BV Status in the Output Label Name: box.
- Click Change.
- Click OK.
- Specify that you want to convert the predictor variable so the presence of the risk factor is first in alphabetic order. Here Old comes before Young..
- Repeat the previous two steps to convert ageUnder25 into a new variable named AgeGroup with a label of Age Group.
- Tell SPSS to do a cross tabulation.
- From the Analyze menu choose Descriptive Statistics > Crosstabs ....
- Drag Age to the Rows(s) box.
- Drag BV to the Column(s) box.
- Click Statistics....
- Check on Risk.
- Click Continue.
- Click Cells....
- In the percentages section check on the Rows checkbox.
- Click Continue.
- Click OK.
- Repeat the steps above for the other predictors.
Figure 5.2 Several binary variables on one graph suitable for a poster or talk

Figure 5.2 Instruction
SPSS can not automatically make this graphic.
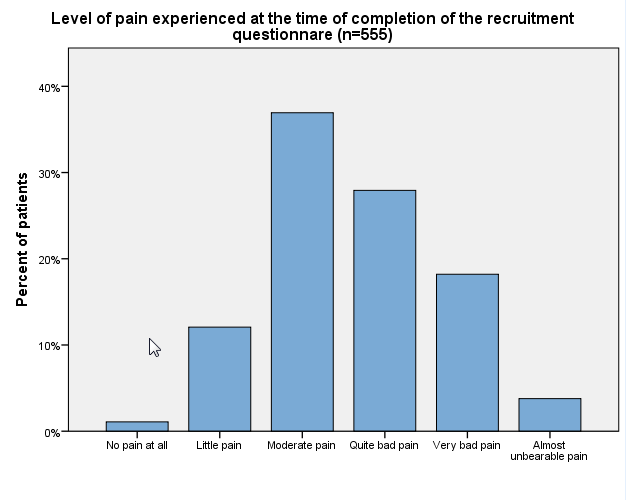
Figure 5.3 Graph for an ordered categorical variable suitable for poster or talk

Figure 5.3 Instruction
Click here to show the instructions as text.- Open the file.
- From the File menu choose Open> Data ....
- Find the file lbp.sav and open it.
- Tell SPSS to display words instead of secret code numbers.
- Select the window showing the lbp dataset.
- Click on Variable View (at the bottom of the window).
- Click the Values box/cell for the pain variable.
- Click on the ....
- Type 1 in the Values: box.
- Type No pain at all in the Label: box.
- Click Add.
- Type 2 in the Values: box.
- Type Little pain in the Label: box.
- Click Add.
- Type 3 in the Values: box.
- Type Moderate pain in the Label: box.
- Click Add.
- Type 4 in the Values: box.
- Type Quite bad pain in the Label: box.
- Click Add.
- Type 5 in the Values: box.
- Type Very bad pain in the Label: box.
- Click Add.
- Type 6 in the Values: box.
- Type Almost unbearable pain in the Label: box.
- Click Add.
- Click OK.
- Tell SPSS to do the graphic.
- From the Graphics menu choose Chart Builder....
- Add the details on the graphic.
- If a window appears asking you to set measurement level, click OK.
- Click the Gallery button (in the lower part of the window).
- Click Bar.
- Double click the upper left picture (the simple bar chart).
- Drag pain to the X-Axis? place holder in the graphic preview (the right windowpane).
- Change the Statistic from Count to be Percentage?.
- Click Apply.
- In the Edit Properties of: window click X-Axis1(Bar1).
- In the Axis label: box erase pain.
- Click Apply.
- In the Edit Properties of: window click Y-Axis1(Bar1).
- In the Axis label: box type Percentage of Patients.
- Click Add.
- In the Chart Builder window click OK.
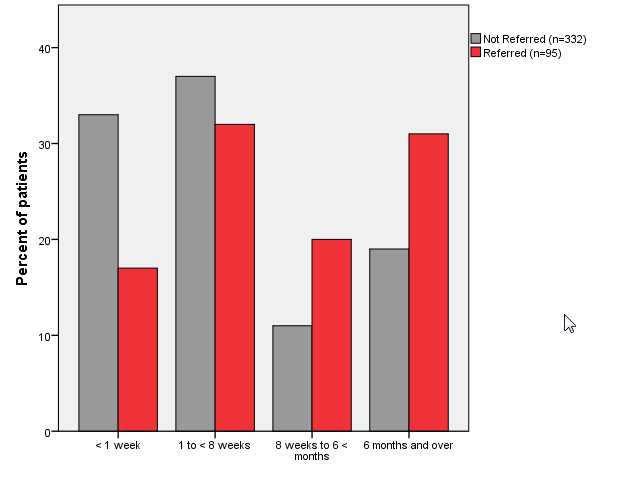
Figure 5.4 Graph comparing two groups of patients suitable for poster or talk

Figure 5.4 Instruction
Click here to show the instructions as text.- Open the file.
- From the File menu choose Open> Data ....
- Find the file xray.sav and open it.
- Tell SPSS to display words instead of secret code numbers for the time variable.
- Select the window showing the xray dataset.
- Click on Variable View (at the bottom of the window).
- Click the Values box/cell for the when variable.
- Click on the ....
- Type 1 in the Values: box.
- Type <1 week in the Label: box.
- Click Add.
- Type 2 in the Values: box.
- Type 1 week to < 8 weeks in the Label: box.
- Click Add.
- Type 3 in the Values: box.
- Type 8 week to < 6 months in the Label: box.
- Click Add.
- Type 4 in the Values: box.
- Type 6 months and over in the Label: box.
- Click Add.
- Click OK.
- Tell SPSS to make the bar chart.
- From the Graphics menu choose Chart Builder... .
- If a window appears asking you to set measurement level, click OK.
- Click the Gallery button (in the lower part of the window).
- Click Bar.
- Double click the picture 2nd from the left picture (Clustered Bar).
- Drag when to the X-Axis? place holder in the graphic preview (the right windowpane).
- In the Edit Properties of: window click X-Axis1(Bar1).
- In the Axis label: box erase the word when.
- Click Apply.
- Drag percent to the Y-Axis? place holder in the graphic preview (the right windowpane).
- In the Edit Properties of: window click Y-Axis1(Bar1).
- In the Axis label: box type Percent of patients.
- Click Apply.
- Drag result to the Cluster on X: set color place holder in the graphic preview (the right windowpane).
- In the Edit Properties of: window click GroupColor.
- In the Axis label: box erase result.
- Click Apply.
- In the Chart Builder window click OK.
- Set the colours for the graphic.
- Double click the graphic to open the Chart Editor.
- Click on one of the Referred coulor squares in the legend.
- Click on the colour pallet (2nd from the right in the middle row).
- Click on the red colour patch.
- Click on one of the Not Referred colour squares in the legend.
- Click on the colour pallet.
- Click on the gray colour patch.
- Close the Chart Editor Window.
Figure 5.5 Calculating the confidence interval of a geometric mean

Figure 5.5 Instruction
SPSS can not automatically calculate a geometric mean with confidence limits
Table 5.3 Presenting several types of variables with a common theme in one table

Table 5.3 Instruction
Click here to show the instructions as text.Figure 5.6

Figure 5.6 Instruction
SPSS can not automatically make this graphic.
Figure 5.7

Figure 5.7 Instruction
SPSS can not automatically make this graphic.