Home > Output
Chapter 8: Analysing matched or paired data using STATA
Figure 8.1 Output for a paired t test

Figure 8.1 Code

Click here to show code as text
use "C:\Projects\Books\Presenting\data\stataData\cotinine.dta", clear
ttest cotearly = cotlate
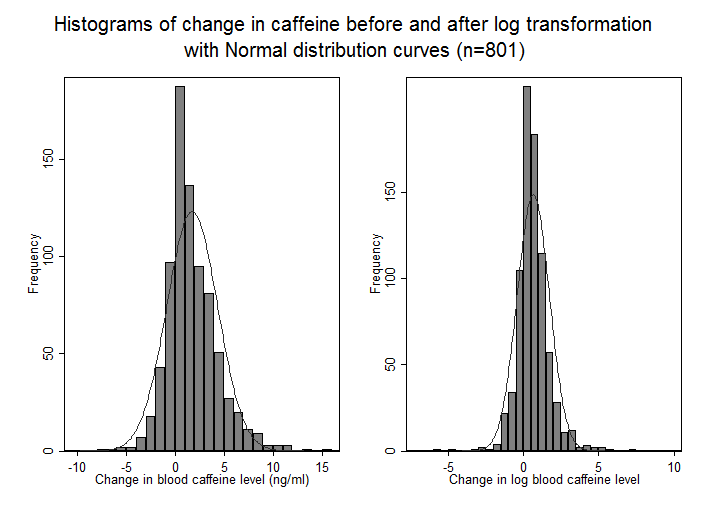
Figure 8.2 Histogram of skewed paired data (a) before and (b) after log transformation with normal distribution curve

Figure 8.2 Code

Click here to show code as text
use "C:\Projects\Books\Presenting\data\stataData\cotinine.dta", clear

 **create histogram for change in blood caffeine then for change in log caffeine

histogram cafdiff, width(1) start(-10) frequency normal ylabel(0(50)150) ///
	xtitle(Change in blood caffeine level (ng/ml)) xlabel(-10(5)15) title(, size(small) span)

graph save Graph "C:\blah\fig 8.2a.gph"

histogram logcafdiff, width(.5) start(-7) frequency normal ylabel(0(50)150) ///
	xtitle(Change in log blood caffeine level) xlabel(-5(5)10) title(, size(small) span)

graph save Graph "C:\blah\fig 8.2b.gph"

**combine 2  histograms into one graph

graph combine "C:\blah\fig 8.2a.gph" "C:\blah\fig 8.2b.gph", ///
	title(Histograms of change in caffeine before and after log transformation, size(medium) span) ///
	subtitle(with Normal distribution curves (n=801))
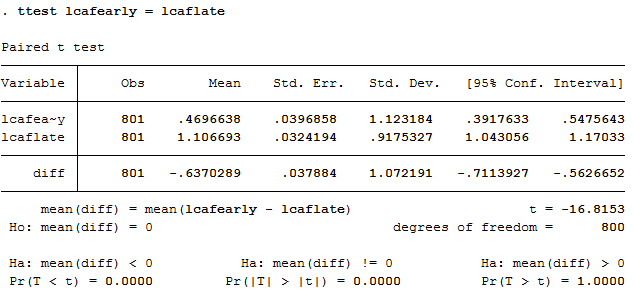
Figure 8.3 and Box 8.5 Paired t test with back- transformation

Figure 8.3 and Box 8.5 Code

Click here to show code as text
use "C:\Projects\Books\Presenting\data\stataData\cotinine.dta", clear
ttest lcafearly = lcaflate
Figure 8.4 to Box 8.7 Presenting the findings of the Wilcoxon test for matched pairs

Figure 8.4 to Box 8.7 Code

Click here to show code as text
use "C:\Projects\Books\Presenting\data\stataData\sleep.dta", clear
gen diffawakening = proneawakenings - supineawakenings
signtest diffawakening = 0
Figure 8.5 Output for a matched case-control analysis

Figure 8.5 Code

Click here to show code as text
use "C:\Projects\Books\Presenting\data\stataData\casecontrol.dta", clear
mcc case control
Box 8.10 Presenting the results of matched case- control analysis

Box 8.10 Code

Click here to show code as text
use "C:\Projects\Books\Presenting\data\stataData\casecontrol.dta", clear
** use casecontrol for 1st analysis as in fig 8.5

mcc case control

** now use Stata immediate command

mcci 411 69 45 7
Figure 8.6 Output for McNemar’s test with ratio of paired proportions


Figure 8.6 Code

Click here to show code as text
use "C:\Projects\Books\Presenting\data\stataData\cotinine.dta", clear

tabulate nausea1 nausea2

mcc nausea1 nausea2


